
Bristol’s clean-air experiment, by the numbers
Clean air, costly penalties: what Bristol’s Clean Air Zone has changed
Analysis of council data suggests Bristol’s Clean Air Zone has coincided with falling nitrogen dioxide levels and fewer pollution hotspots, while generating more than £70m in recorded income from charges and penalties.
When Bristol’s Clean Air Zone went live in November 2022, it was introduced as a public health measure: a way to bring illegal levels of nitrogen dioxide down as quickly as possible.
Nearly two and a half years later, council-published data suggests the city’s air is moving in the right direction. But the same published records also show another side to the scheme: tens of millions of pounds in income, most of it from penalty charge notices rather than daily Clean Air Zone charges.
Analysis of Bristol’s published nitrogen dioxide diffusion-tube data shows that average NO₂ across monitoring sites fell from 31.4 micrograms per cubic metre in 2022 to 25.6 micrograms per cubic metre in 2024, a reduction of about 18.5%.
The number of monitoring sites recording annual mean NO₂ levels above 40 micrograms per cubic metre also fell sharply, from 23 in 2022 to five in 2024.
All five of those remaining above-limit monitoring sites appear to sit within the Clean Air Zone boundary.
At first glance, that looks like a clear success story: fewer places with high NO₂, and a large fall in average pollution levels since the zone began. But air-quality experts say the picture needs careful interpretation.
Professor Jo Barnes, an air-quality expert at UWE Bristol, said the reductions were “moderate average concentration reductions over a two-year period”, because annual NO₂ levels can vary with weather and traffic patterns. However, she said “the number of sites now achieving compliance is more significant”.
She added: “I would be cautious about attributing all of the reduction to the CAZ, but it does appear to have improved local air quality in Bristol.”
The Clean Air Zone was introduced on 28 November 2022 after the government directed Bristol to reduce nitrogen dioxide levels in the shortest possible time. It is a Class D Clean Air Zone, meaning non-compliant private cars are charged as well as taxis, vans, buses, coaches and HGVs.
That makes Bristol one of only two Class D Clean Air Zones in England, alongside Birmingham. Other zones, such as Bath, Bradford, Sheffield and Tyneside, do not charge private cars.
National Clean Air Zone service reports put Bristol’s zone at 1.26 square miles, with 49 enforcement cameras. In 2023–24, the national data suggests Bristol had around 650,000 to 720,000 vehicles driving through the zone each week. The proportion of vehicles classed as non-compliant fell from 5.84% in April 2023 to 4.48% in March 2024.
A separate analysis of automatic-monitor data from Bristol Temple Way and Bristol St Paul’s also suggests roadside NO₂ has fallen since the CAZ was introduced. At Temple Way, an urban traffic site, annual mean NO₂ fell by 23.4% between 2022 and 2024. At St Paul’s, an urban background site, it fell by 18.6% over the same period.
The gap between the two sites also narrowed, suggesting the traffic-exposed site improved slightly faster than the background site. But this is only supporting evidence. The automatic-monitor data covers two locations, while the diffusion-tube dataset gives a wider city picture.
The council says the zone is working.
Councillor Abi Finch, chair of Bristol City Council’s Environment and Sustainability Committee, said: “Air pollution is one of the most significant environmental risks to our health. Cleaner air means healthier lives, especially for our most vulnerable residents such as children, older people, and those with respiratory conditions.”
She added: “The Clean Air Zone continues to deliver real improvements to Bristol’s air quality, and the figures show that we are moving in the right direction, not just inside the CAZ but across the whole city as, on average, areas outside the zone have also seen a reduction in air pollution since the CAZ was introduced.”
But the council also acknowledged that legal compliance is not the end of the story.
“While we are pleased with the progress that has been made, there is still more work to do,” Cllr Finch said. “The legal limits are still a long way off the WHO guidance for healthy air. That’s why we’ll be developing a Clean Air Strategy over the next year, to help us go beyond legal compliance towards healthy air. This is about creating a safer, greener, and more sustainable future for everyone.”
The remaining above-limit sites matter because NO₂ is not an abstract measurement. It is a traffic-related pollutant linked to respiratory and cardiovascular harm, with children, older people and people with existing lung conditions among those most at risk.
But Professor Barnes warned that monitoring sites do not always represent what people are exposed to over a full year. Roadside or kerbside monitors can record higher concentrations because they are close to traffic, while annual legal exposure is usually assessed at places such as residential building facades.
“As NO₂ tends to drop off quite quickly from source, these distance corrections often mean concentrations at relevant receptors drop below 40 µg/m³,” she said.
She also said the fact that the remaining above-limit monitoring sites are within the Clean Air Zone is not, by itself, surprising.
“That these are within the CAZ is not of significance since most of these sites would have had concentrations much higher than other sites therefore required greater reductions to achieve compliance,” she said.
The air-quality data tells one part of the story. The money tells another.
Bristol’s Parking Services Annual Reports show the Clean Air Zone recorded about £70.6m in income across 2022–23, 2023–24 and 2024–25. That includes £22.2m from daily CAZ charges and £48.3m from CAZ penalty charge notice income.
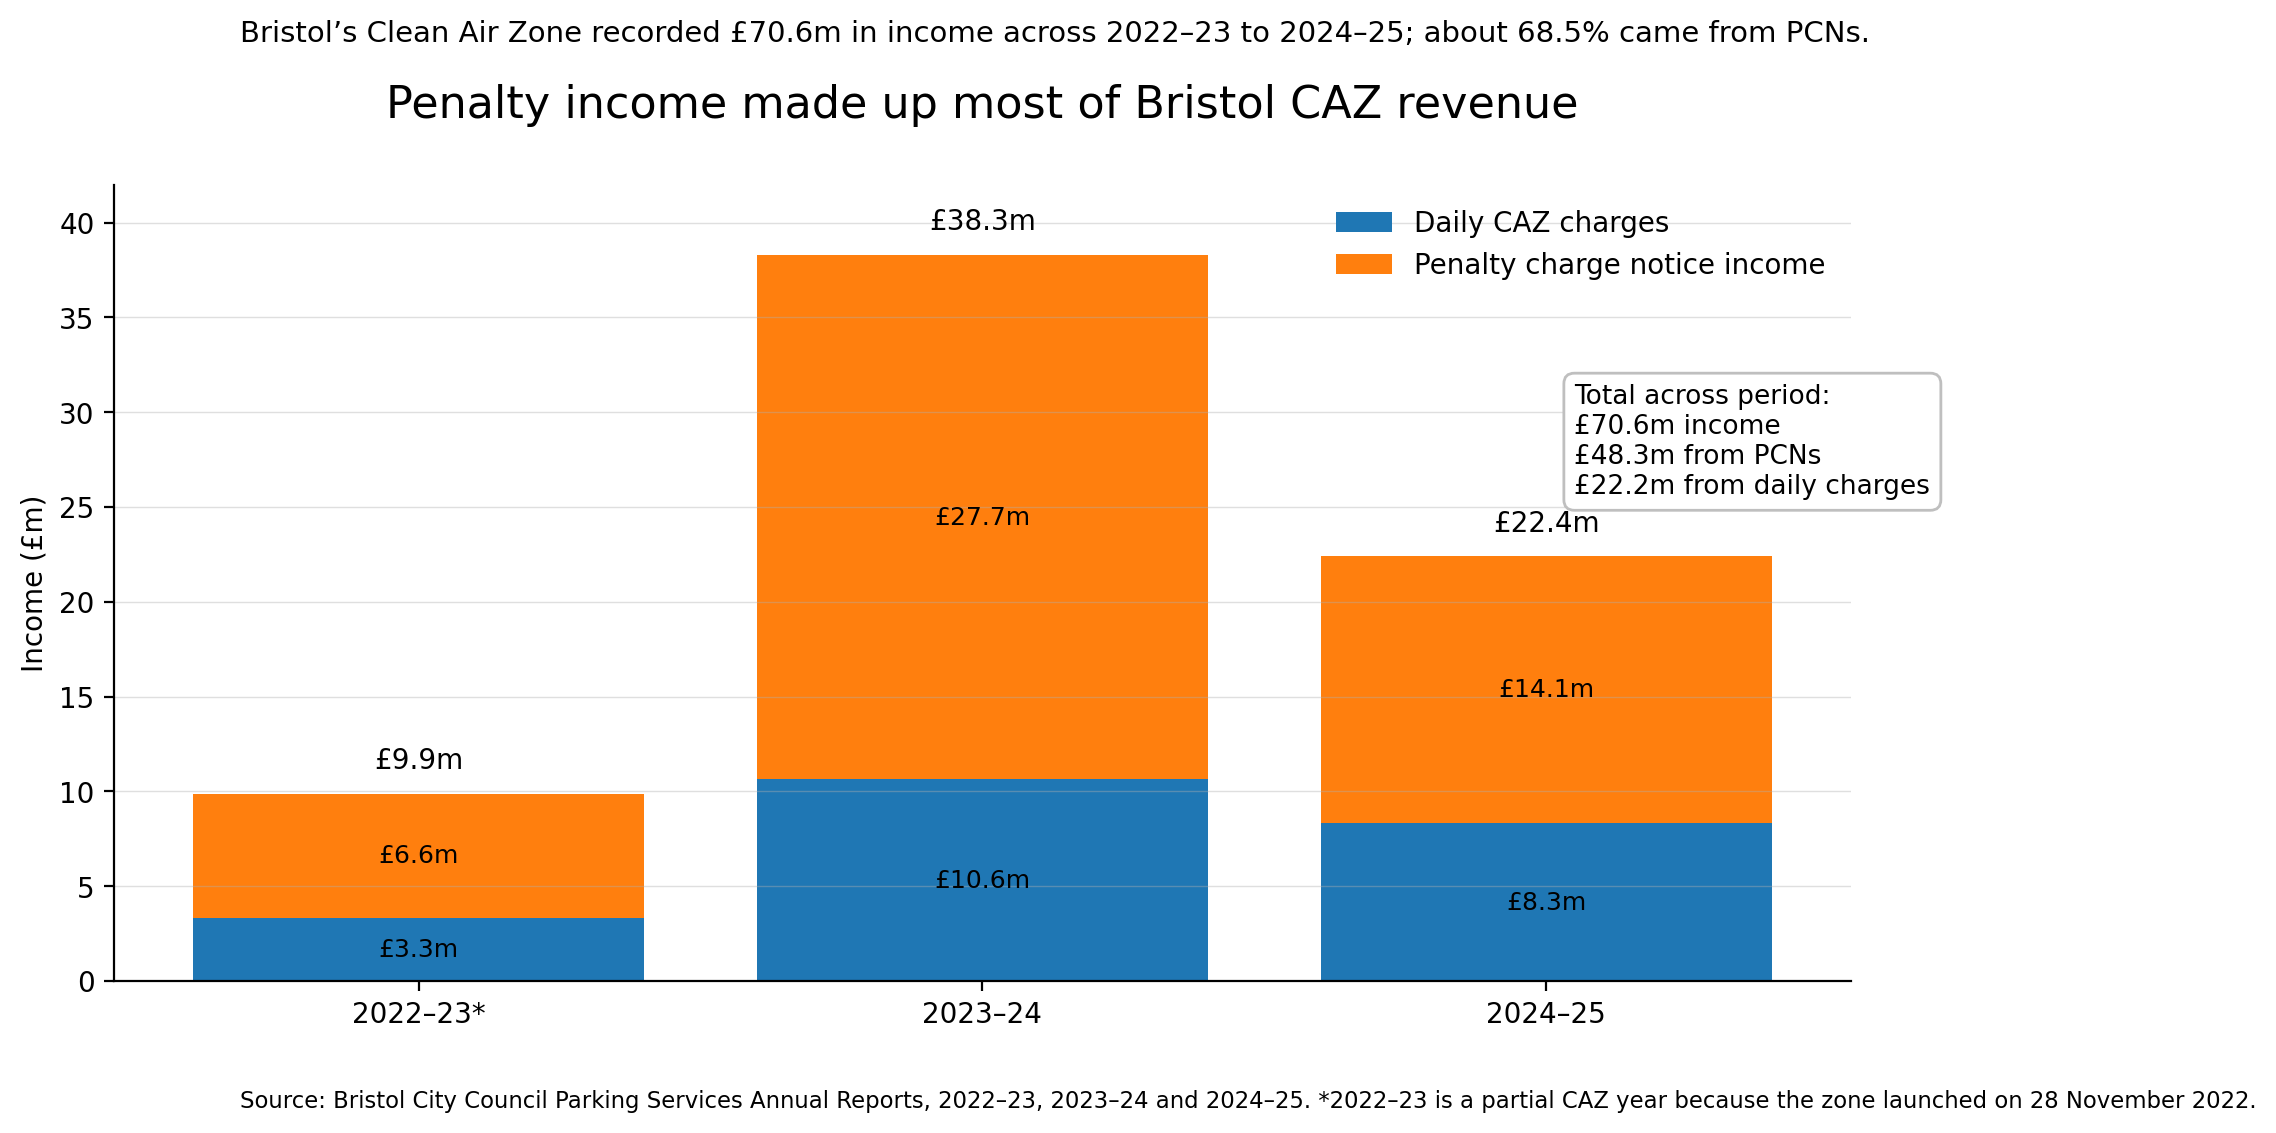
That means PCN income accounted for about 68.5% of recorded CAZ income across the first partial financial year and the following two full financial years.
The first reporting period, 2022–23, covered only the first few months of the scheme. In that period, the CAZ recorded £3.3m in daily charges and £6.6m in PCN income.
In 2023–24, the first full financial year after launch, CAZ income rose sharply. The annual report recorded £10.6m in daily charges and £27.7m in PCN income, making total income £38.3m.
In 2024–25, total CAZ income fell to £22.4m, made up of £8.3m from daily charges and £14.1m from PCN income.
The figures suggest the scheme has generated substantial money even as vehicle compliance has improved. That may sound contradictory, but it reflects the scale of traffic through the zone and the difference between daily charges, paid by drivers of non-compliant vehicles, and penalties issued when drivers fail to pay or do not have a valid exemption.
The 2024–25 Parking Services Annual Report states that 344,365 CAZ PCNs were issued during that financial year. It also records 15,117 accepted appeals and 22,708 rejected appeals.
However, there is a data issue in the same report. It says 148,917 CAZ PCNs issued in 2024–25 had been paid to date, describing this as 50.5% of all CAZ PCNs issued. But 148,917 is not 50.5% of 344,365.
Bristol City Council was asked to clarify this figure, confirm total CAZ income, explain why PCN income makes up the larger share of revenue, and provide details of how proceeds have been allocated. The council provided a statement and said that answers to specific questions would require a Freedom of Information request.
Published financial statements say CAZ income is ringfenced for purposes set out in the Bristol Clean Air Zone Order. By the end of March 2025, reports show transfers from CAZ reserves had gone towards improving public transport, improving and maintaining infrastructure, and local transport projects.
The reported CAZ reserve balance stood at £25.6m at 31 March 2025.
That leaves a public-interest question that goes beyond whether the scheme has reduced NO₂: how clearly can residents see where the money is going, and how fairly is the burden falling on drivers who receive penalties?
Professor Barnes said the CAZ should be understood in its original policy context.
“The CAZ was introduced explicitly as a temporary measure to achieve compliance with the annual mean limit value for NO₂ under instruction from national government,” she said.
She added: “The CAZ is therefore primarily an air quality policy measure, not a transport one.”
That distinction matters. A Clean Air Zone can reduce NO₂ from older, more polluting vehicles, but it does not automatically solve congestion, cut overall traffic, remove particulate pollution from tyre and brake wear, or deliver the broader shift away from private car use that many climate and transport policies aim for.
Bristol’s CAZ now appears to sit at the centre of two linked debates. The first is about health: how quickly the city can move from legal compliance towards genuinely healthy air. The second is about accountability: how a scheme that has recorded more than £70m in income is judged, explained and reinvested.
The data suggests Bristol’s air has improved since the Clean Air Zone was introduced. But the story is not as simple as clean air versus angry drivers, or public health versus penalties.
The zone appears to be helping. Some pollution hotspots remain. Millions have been raised. Some figures still need clearer explanation.
For a policy designed to clean up the air people breathe every day, that transparency matters too.